The Central Bureau of Statistics has published another report on salaries and wages of persons engaged in the entities throughout Nepal. The first ever National Economic Census 2018 was conducted with the technical support from Japan International Cooperation Agency (JICA). This covered all fixed and movable establishments that existed in Nepalat the reference date of the census operation that was April 14, 2018,. As per the census data, there were 900,924 entities in Nepal where 3,115,112 persons were engaged.Link
The economic census collected information on average monthly salaries and wages from the entities with paid employees. There were 219,303 entities with paid employees in Nepal and the number of paid employees were 1,709,101. The annual salaries and wages came out to be Rs. 421 billion.
Looking at the annual salaries and wages by industry, “Manufacturing” such as tea factories and brick factories was the largest section with Rs. 86 billion accounting for 20.3% followed by “Education” such as schools, universities with Rs. 68 billion (16.3%) and “Wholesale and retail trade; repair of motor vehicles and motorcycles” as shops, supermarkets and department stores was Rs. 66 billion (15.6%).
In Nepal, almost 80% of the entities with paid employees were registered. The annual salaries and wages of “Registered” entities were Rs. 406 billion accounting for 96.4% of the total. On the other hand, those of “Not registered”entities were 15 billion (3.5%) only. It means most of salaries and wages are paid by registered entities.
Nepal had 36,172 entities with paid employees and female managers; and their annual salaries and wages accounted for 8.5% of the total.Looking at the annual salaries and wages of entities with female managers by industry, “Financial and insurance activities” was the largest section with Rs. 7.2 billion accounting for 20.1%, followed by “Education” accounting Rs, 6.8 billion (19.0%), “Wholesale and retail trade, repair of motor vehicles and motorcycles” accounting 4.1 billion (11.5%).
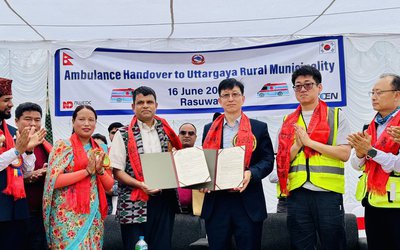
Looking at the annual salaries and wages by district, Kathmandu, the capital was the largest district with Rs. 141 billion accounting for 33.4%.Lalitpur was Rs. 32 billion (7.6%), Morang was Rs. 21 billion (5.0%),Rupandehi was Rs. 18.5 billion (4.38%), Kaskiwas Rs. 18.3 billion (4.35%). There were big differences between three districts in Kathmandu Valley and other districts. This is because many head offices and entities with paid employees are located in Kathmandu Valley. All financial statements are managed by head office. Therefore, for example, even if big factories are being operated in Morang, their financial data are counted in Kathmandu if their head offices are located in Kathmandu. On the other hand, Rukum East was the smallest district with Rs. 100 million accounting for 0.02%, Manang was 103 million (0.02%); Rasuwa was 173 million (0.04%).
Central Bureau of Statistics also published the national profile no 2 from NEC 2018 which contains key statistical tables generated from cross tabulation between industry and size of person engaged for some specific characteristics.
- The Situation Pushes Women Journalists To Speak Louder, Experts Emphasize
- Jun 30, 2025
- SPI NEPAL: Prosperity Through Clean Energy
- Jun 30, 2025
- PM Oli Meets Spanish Prime Minister
- Jun 30, 2025
- FM Dr. Rana Said Nepal recognises constitutional guarantees to citizens' right to food
- Jun 30, 2025
- Weather Forecast: Generally Cloudy With Heavy Rainfall Is Likely In One Or Two Places Of Kathamandu, Biratnagar And Pokhara
- Jun 30, 2025